News
Michael Jaeger unpacks HMRC’s report on the initial uptake of the UK’s Patent Box
23 December 2016
The UK’s Patent Box came into effect on 1 April 2013. Under the scheme UK companies are able to pay a reduced rate of Corporation Tax on certain profits derived from patented technology. HM Revenue & Customs (HMRC) published its first report¹ on the uptake of the scheme on 14 September 2016, and that report includes a number of notable statistics, which are discussed below. This article considers the published figures and considers their relevance in the wider context of Corporation Tax revenue.
It has taken a while
The report details the number of companies benefiting from Patent Box and the extent to which they have done so in the first year of the scheme, namely the fiscal year 2013-14². More than two years have passed since the end of the fiscal year under consideration. Why has it taken HMRC such a long time to compile a report on the take-up of the scheme?
The reason for the delay in reporting on that year’s Patent Box claims is as follows. Companies are able to notify HMRC that they wish to benefit from Patent Box within two years after the end of the accounting period in which the relevant profits arise³. This means that where a company’s fiscal year ended on 31 March 2014, it could have filed a Patent Box claim by 31 March 2016, which makes the delay understandable. However, if a company’s accounting year runs in parallel with the calendar year then for the year 2014, the first three months of which coincide with the last three months of the first year of Patent Box’s implementation, the company would have been able to claim Patent Box relief until the end of 2016. For such companies it appears that the HMRC’s report may be premature, rather than late. One must conclude from the release of the report that HMRC believes that the majority of companies who intend to claim Patent Box relief for the 2013-14 fiscal year had done so by the time that the report was compiled.
Timeline for the next report
The report states⁴ that HMRC is considering if it will be feasible to publish provisional statistics gathered only one year after the end of the relevant fiscal year. This would mean that by autumn 2017 we should have sight of full figures for the 2014-15 fiscal year as well as provisional figures for the 2015-16 fiscal year. Presumably HMRC is confident that the bulk of the Patent Box claims will have been made within 12 months of the accounting period in which the relevant profits and income arise, reinforcing the final point made in the previous paragraph.
A drop in the ocean
The total amount of Patent Box relief claimed by companies in 2013-14 was £342.9 million⁵. To put this into perspective, Corporation Tax receipts in 2013/14 were £39.6 billion⁶. This equates to around 115 times the value of the Patent Box relief. Of this £39.6 billion, £3.3 billion came from North Sea companies⁷, leaving £36.3 billion coming from other companies, equivalent to a multiple of 105 times the Patent Box relief.
A disappointing take-up
When the scheme was first proposed, the Government undertook an impact assessment, in which it forecast that the fiscal impact of Patent Box would be £500m in the 2013-14 fiscal year⁸. Since the actual figure for claims was only 69{e27634494e39db391c4a3c1babcce9c96667e0da0c02f00a98e80c871bbff07c} of the anticipated figure, this shows that take-up was lower than expected.
In a similar vein, a mere 700 companies⁹ claimed Patent Box relief. This is a drop in the ocean when considering that 1,117,780 companies¹⁰ paid Corporation Tax in 2013/14. This means that only 1 in every 1,600 of the Corporation Tax paying companies took advantage of the Patent Box scheme.
Company size and Patent Box
| Company size | Companies | Relief claimed under Patent Box | ||
| Number | Number as a percentage of total | Amount (£ million) | Amount as a percentage of total | |
| Large | 225 | 32.1{e27634494e39db391c4a3c1babcce9c96667e0da0c02f00a98e80c871bbff07c} | 327.2 | 95.4{e27634494e39db391c4a3c1babcce9c96667e0da0c02f00a98e80c871bbff07c} |
| Medium | 175 | 25.0{e27634494e39db391c4a3c1babcce9c96667e0da0c02f00a98e80c871bbff07c} | 11.8 | 3.4{e27634494e39db391c4a3c1babcce9c96667e0da0c02f00a98e80c871bbff07c} |
| Small | 170 | 24.3{e27634494e39db391c4a3c1babcce9c96667e0da0c02f00a98e80c871bbff07c} | 3 | 0.9{e27634494e39db391c4a3c1babcce9c96667e0da0c02f00a98e80c871bbff07c} |
| Micro | 120 | 17.1{e27634494e39db391c4a3c1babcce9c96667e0da0c02f00a98e80c871bbff07c} | 0.9 | 0.3{e27634494e39db391c4a3c1babcce9c96667e0da0c02f00a98e80c871bbff07c} |
| Unknown | 5 | 0.7{e27634494e39db391c4a3c1babcce9c96667e0da0c02f00a98e80c871bbff07c} | 0.1 | 0.0{e27634494e39db391c4a3c1babcce9c96667e0da0c02f00a98e80c871bbff07c} |
| All | 700¹¹ | 100{e27634494e39db391c4a3c1babcce9c96667e0da0c02f00a98e80c871bbff07c} | 342.9¹² | 100{e27634494e39db391c4a3c1babcce9c96667e0da0c02f00a98e80c871bbff07c} |
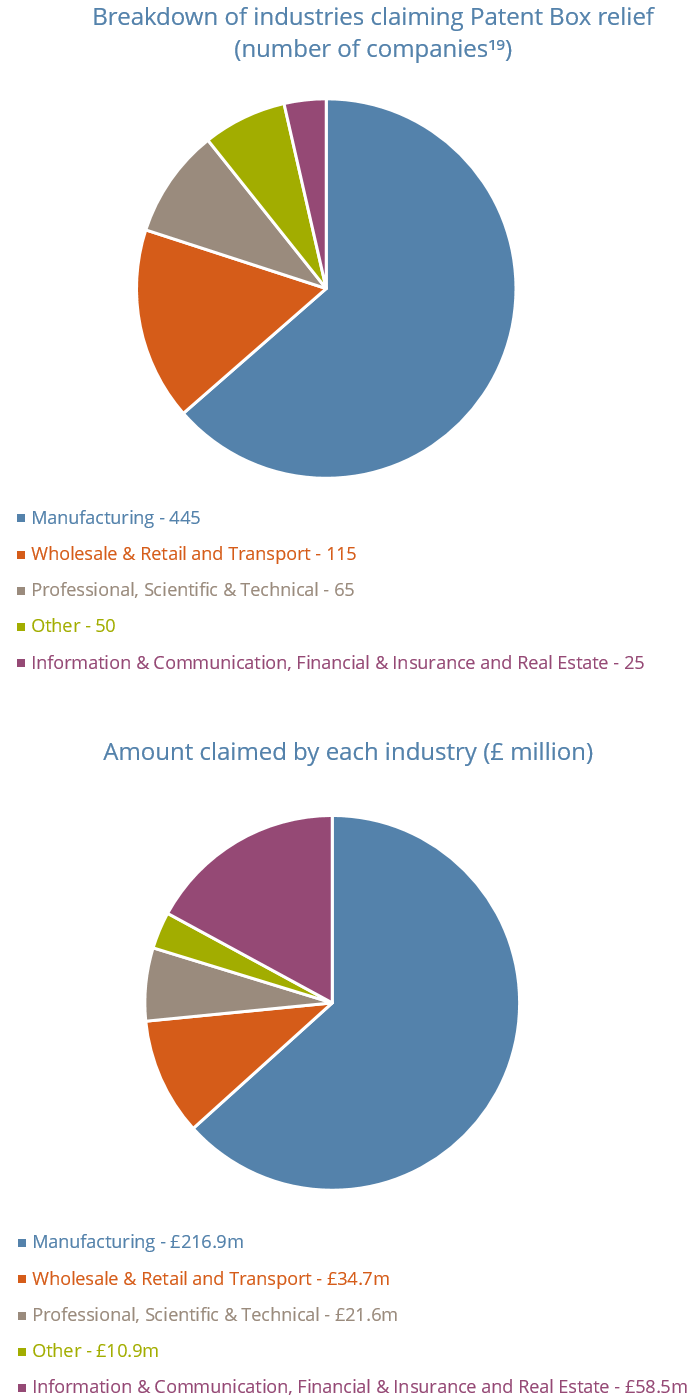
Patent Box relief by Industry Sector
| Industry Sector | Companies | Relief claimed under Patent Box | ||
| Number | Number as a percentage of total | Amount (£ million)¹⁷ | Amount as a percentage of total | |
| Manufacturing | 445 | 63.6{e27634494e39db391c4a3c1babcce9c96667e0da0c02f00a98e80c871bbff07c} | 216.9 | 63.3{e27634494e39db391c4a3c1babcce9c96667e0da0c02f00a98e80c871bbff07c} |
| Construction | 15 | 2.1{e27634494e39db391c4a3c1babcce9c96667e0da0c02f00a98e80c871bbff07c} | – | – |
| Wholesale & Retail and Transport | 115 | 16.4{e27634494e39db391c4a3c1babcce9c96667e0da0c02f00a98e80c871bbff07c} | 34.7 | 10.1{e27634494e39db391c4a3c1babcce9c96667e0da0c02f00a98e80c871bbff07c} |
| Information & Communication, Financial & Insurance and Real Estate | 25 | 3.60{e27634494e39db391c4a3c1babcce9c96667e0da0c02f00a98e80c871bbff07c} | 58.5 | 17.1{e27634494e39db391c4a3c1babcce9c96667e0da0c02f00a98e80c871bbff07c} |
| Professional, Scientific & Technical | 65 | 9.3{e27634494e39db391c4a3c1babcce9c96667e0da0c02f00a98e80c871bbff07c} | 21.6 | 6.3{e27634494e39db391c4a3c1babcce9c96667e0da0c02f00a98e80c871bbff07c} |
| Admin & Support Services, Education, Health and Other | 35 | 5.0{e27634494e39db391c4a3c1babcce9c96667e0da0c02f00a98e80c871bbff07c} | – | – |
| All | 700 | 100{e27634494e39db391c4a3c1babcce9c96667e0da0c02f00a98e80c871bbff07c} | 342.9 | 100{e27634494e39db391c4a3c1babcce9c96667e0da0c02f00a98e80c871bbff07c} |
Whilst there is no doubt that the bulk of UK companies do not set out to be innovative and are consequently unlikely to be eligible for the scheme, this nevertheless represents a further indicator of disappointing take-up.
Company size and Patent Box
Below is a table showing the Patent Box relief data by company size. One eye-catching figure highlighted in the second Key Point¹³ of the report is that 95.4{e27634494e39db391c4a3c1babcce9c96667e0da0c02f00a98e80c871bbff07c} (£327.2m) of the total Patent Box relief was claimed by 225 ‘large’ companies¹⁴ who made up 32.1{e27634494e39db391c4a3c1babcce9c96667e0da0c02f00a98e80c871bbff07c} of the total number of Patent Box claiming companies. On the face of it this statistic looks surprisingly high, however, looks can sometimes be deceiving and one should not be taken aback by this figure. Simply put, larger companies have a higher revenue and pay more Corporation Tax than smaller companies. This can be seen from the Corporation Tax receipt figures for 2013/14 where the top 35.7{e27634494e39db391c4a3c1babcce9c96667e0da0c02f00a98e80c871bbff07c} of liable companies paid 93.6{e27634494e39db391c4a3c1babcce9c96667e0da0c02f00a98e80c871bbff07c} of Corporation Tax¹⁵. Hence in this respect the Patent Box figures are very much in line with the general Corporation Tax receipts¹⁶.
In light of these figures and returning to the question of the amount of Patent Box relief claimed compared to the amount initially forecast by the Government, it is clear that the lower than anticipated overall claimed Patent Box relief came from fewer large companies making claims, or their claims being smaller than originally anticipated.
Whilst around one-third of the companies claiming Patent Box relief were ‘large’, around one sixth of the companies (120 companies) were ‘micro’ entities, i.e., had nine or less employees. It is encouraging that the benefits of Patent Box are being enjoyed by companies of such a small size.
Break-even point for claiming Patent Box relief?
The average amount of Patent Box relief claimed by small and micro-sized companies was £17.6k and £7.5k respectively. There is a direct cost involved in qualifying for Patent Box relief, namely the cost of applying for, obtaining and maintaining a patent. An argument presented in favour of pursuing Patent Box relief is that if the benefit received over the life of the patent is greater than the cost of obtaining and maintaining a qualifying patent then it makes financial sense to take advantage of the scheme. Since on a simple level an annual benefit of £7.5k equates to a benefit of £75k if the patented product has a life of ten years and double that if it is maintained for its full term, it can be surmised that the threshold for choosing to pursue Patent Box relief requires a clear financial benefit beyond the argument referred to above.
Patent Box relief by Industry Sector
Section 3.2 of the report provides a breakdown of how companies in different industries have claimed Patent Box relief, as shown in the table “Patent Box relief by Industry Sector” above. Some industry sectors have been combined together to avoid disclosure of confidential information, but the way in which these industries have been combined is arguably unsatisfactory. In addition, the grouping of industries makes it difficult to compare the Patent Box relief data with a breakdown of Corporation Tax data available for these sectors¹⁸. In the future if more companies claim Patent Box relief then this should reduce the need to anonymise data and allow a finer breakdown of industry sectors. The industry data can be shown graphically, where the Construction and Admin & Support Services, etc. industries have been combined as ‘other’.
Company size and Patent Box
| Region | Companies | Relief claimed under Patent Box | ||
| Number¹⁹ | Number as a percentage of total | Amount (£ million) | Amount as a percentage of total | |
| North East | 20 | 2.9{e27634494e39db391c4a3c1babcce9c96667e0da0c02f00a98e80c871bbff07c} | 1.6 | 0.5{e27634494e39db391c4a3c1babcce9c96667e0da0c02f00a98e80c871bbff07c} |
| North West | 55 | 7.9{e27634494e39db391c4a3c1babcce9c96667e0da0c02f00a98e80c871bbff07c} | 3.3 | 1.0{e27634494e39db391c4a3c1babcce9c96667e0da0c02f00a98e80c871bbff07c} |
| Yorkshire & Humberside | 75 | 10.7{e27634494e39db391c4a3c1babcce9c96667e0da0c02f00a98e80c871bbff07c} | 28.6 | 8.3{e27634494e39db391c4a3c1babcce9c96667e0da0c02f00a98e80c871bbff07c} |
| East Midlands | 55 | 7.9{e27634494e39db391c4a3c1babcce9c96667e0da0c02f00a98e80c871bbff07c} | 22.4 | 6.5{e27634494e39db391c4a3c1babcce9c96667e0da0c02f00a98e80c871bbff07c} |
| West Midlands | 80 | 11.4{e27634494e39db391c4a3c1babcce9c96667e0da0c02f00a98e80c871bbff07c} | 14.2 | 4.1{e27634494e39db391c4a3c1babcce9c96667e0da0c02f00a98e80c871bbff07c} |
| East of England | 90 | 12.9{e27634494e39db391c4a3c1babcce9c96667e0da0c02f00a98e80c871bbff07c} | 28.8² | 8.4{e27634494e39db391c4a3c1babcce9c96667e0da0c02f00a98e80c871bbff07c} |
| London | 70 | 10.0{e27634494e39db391c4a3c1babcce9c96667e0da0c02f00a98e80c871bbff07c} | 196.8 | 57.4{e27634494e39db391c4a3c1babcce9c96667e0da0c02f00a98e80c871bbff07c} |
| South East | 115 | 16.4{e27634494e39db391c4a3c1babcce9c96667e0da0c02f00a98e80c871bbff07c} | 18.6 | 5.4{e27634494e39db391c4a3c1babcce9c96667e0da0c02f00a98e80c871bbff07c} |
| South West | 65 | 9.3{e27634494e39db391c4a3c1babcce9c96667e0da0c02f00a98e80c871bbff07c} | 12.0 | 3.5{e27634494e39db391c4a3c1babcce9c96667e0da0c02f00a98e80c871bbff07c} |
| Scotland | 35 | 5.0{e27634494e39db391c4a3c1babcce9c96667e0da0c02f00a98e80c871bbff07c} | 9.7 | 2.8{e27634494e39db391c4a3c1babcce9c96667e0da0c02f00a98e80c871bbff07c} |
| Wales | 20 | 2.9{e27634494e39db391c4a3c1babcce9c96667e0da0c02f00a98e80c871bbff07c} | 4.8 | 1.4{e27634494e39db391c4a3c1babcce9c96667e0da0c02f00a98e80c871bbff07c} |
| Northern Ireland | 15 | 2.1{e27634494e39db391c4a3c1babcce9c96667e0da0c02f00a98e80c871bbff07c} | 2.0 | 0.6{e27634494e39db391c4a3c1babcce9c96667e0da0c02f00a98e80c871bbff07c} |
| All | 700 | 100{e27634494e39db391c4a3c1babcce9c96667e0da0c02f00a98e80c871bbff07c} | 342.9 | 100{e27634494e39db391c4a3c1babcce9c96667e0da0c02f00a98e80c871bbff07c} |
Patent Box relief by region
Number of companies¹⁹ and amount claimed by region (with the amount as the percentage of the total)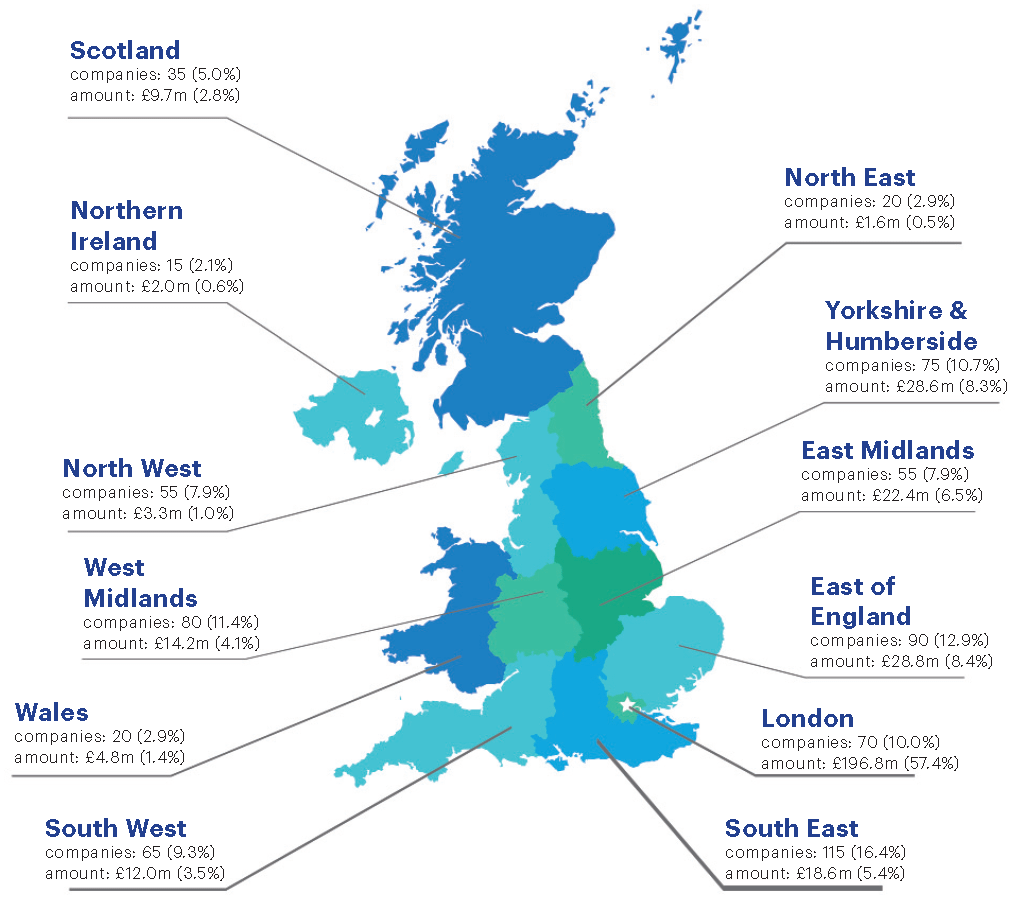
The charts above show the amount claimed by each industry. When comparing these charts one striking feature is the relatively larger amount of Patent Box relief claimed by companies in the Information & Communication, Financial & Insurance and Real Estate industries sectors. This equates to an average Patent Box relief of £218k per company in this sector.
Patent Box relief by region
Section 3.3 of the report provides a breakdown of how companies in different regions claimed Patent Box relief. This regional data is shown in the table above. The regional data can be shown graphically as set out above. What is apparent from these graphs and figures is that the amount claimed by the 70 London-based companies makes up the majority (57.4{e27634494e39db391c4a3c1babcce9c96667e0da0c02f00a98e80c871bbff07c}) of the claimed Patent Box relief. In this regard the report notes that the regional distribution data is skewed, since companies can have a single address for tax purposes (for example, a headquarters’ location) even though they may have operations across the UK.
It is of note that across the North East, Scotland, Wales and Northern Ireland only around 90 companies claimed Patent Box relief.
Conclusion
The report provides a window onto the take-up of Patent Box relief in the first year of its introduction. However the need to anonymise some data has made that window more obscure than would be desirable.
One thing that is clear from the report is the number of companies benefitting from Patent Box is disappointing. Whilst it is natural for there to be a slow adoption of a new tax scheme, factors such as the drop in the main Corporation Tax rate²⁰ and the introduction of a more restrictive revised Patent Box scheme²¹ are disincentives to the uptake of the scheme which should be countered by increased Government action to encourage the uptake of Patent Box.
Michael Jaeger
Electronics, Computing & Physics Group
This article was first published in the CIPA Journal, December 2016, Volume 45, Number 12.
Notes and references
- “Statistics on uptake of the Patent Box”, https://www.gov.uk/government/uploads/system/uploads/attachment_data/file/552641/Sep2016_201314_PB_Official_Statistics.pdf
- The period from 1 April 2013 to 31 March 2014.
- “Statistics on uptake of the Patent Box” (see footnote 1)
- ibid.
- ibid. s.2.1, key point 2
- “Corporation Tax Statistics”, HMRC, Released 31 August 2016, page 11
https://www.gov.uk/government/uploads/system/uploads/attachment_data/file/548398/Corporation_Tax_Statistics_August_2016_FINAL.pdf - ibid. Table 11.1B
- Budget 2011, HM Treasury, Table 2.2, line bu (page 46) http://webarchive.nationalarchives.gov.uk/20130129110402/http:/cdn.hm-treasury.gov.uk/2011budget_complete.pdf
- “Statistics on uptake of the Patent Box” (see footnote 1)
- “Corporation Tax Statistics” (see footnote 6), Table 11.6
- The total number of companies in the cells above the ‘All’ row comes to 695, not 700. This is because the numbers of companies claiming the relief have been rounded to the nearest five.
- The total amount of relief claimed in the cells above the ‘All’ row comes to £343 million, not £342.9. This is because the relief has been rounded to the nearest £100,000.
- “Statistics on uptake of the Patent Box” (see footnote 1)
- Company size is based on the EU Enterprise Size Classification as follows:
Size Classification Turnover (€ million) Total assets (€ million) Number of employees Micro 2 2 9 Small 10 10 49 Medium 50 43 249 Large >50 >43 250+ To be classified as a certain size, a company must meet the Employee limit and one or other of the Turnover and Total assets limits.
- “Corporation Tax Statistics” (see footnote 6), Table 11.6. Considering companies paying Corporation Tax in excess of £10k.
- Note that there is not a direct equivalence between the figures in the two reports, since the “Statistics on uptake of the Patent Box” figures are based on company size as defined in Footnote 14 and the figures taken from the “Corporation Tax Statistics” report are based on the amount of tax paid by companies. Nevertheless, the principle of the bulk of Corporation Tax is paid by a minority of companies is still true.
- The amount of relief claimed by the Construction and Admin & Support industries has not be disclosed in order to meet confidentiality
requirements. However, it can be derived that the 50 companies claiming relief in this sector claimed a total of £10.9 million. - Table 11.7 (page 38) of “Corporation Tax Statistics” (see footnote 6).
- Rounded to the nearest five.
- 2013-14 – 23{e27634494e39db391c4a3c1babcce9c96667e0da0c02f00a98e80c871bbff07c}; 2014-15 – 21{e27634494e39db391c4a3c1babcce9c96667e0da0c02f00a98e80c871bbff07c}; 2015-16 – 20{e27634494e39db391c4a3c1babcce9c96667e0da0c02f00a98e80c871bbff07c}; 2017-20 – 19{e27634494e39db391c4a3c1babcce9c96667e0da0c02f00a98e80c871bbff07c}; 2020 onwards 17{e27634494e39db391c4a3c1babcce9c96667e0da0c02f00a98e80c871bbff07c}.
- https://hansard.parliament.uk/lords/2016-09-15/debates/16091542000344/RoyalAssent
If you require further information on anything covered in this briefing, please contact Michael Jaeger (mjaeger@withersrogers.com; +44 207 940 3600) or your usual contact at the firm. This publication is a general summary of the law. It should not replace legal advice tailored to your specific circumstances.
© Withers & Rogers LLP, December 2016